
 Grace Cornish
Today’s modern VPS hosting infrastructure goes beyond simply having servers up and running. Application management, website management, API management, and Docker container management use reliable monitoring tools for the DevOps model to maintain uptime, performance, and end-user trust. We know that even minimal downtime can disrupt customer experiences, revenue, and operational efficiency; thus, open-source uptime monitoring tools are a must for every business.
With these factors in mind, businesses and developers are recognizing the advantages of self-hosted website monitoring tools. These offer greater flexibility and provide more control over their usage and functionality.
When searching for self-hosted uptime monitoring tools, developers often choose between simplicity and advanced observability. In this space, two names stand out: Checkmate and Uptime Kuma. Uptime Kuma is known as an easy-to-use, lightweight, and beginner-friendly open-source solution. Checkmate, on the other hand, is a modern infrastructure observability platform. It offers superior analytics and focuses on Docker monitoring.
This article will help you compare two popular open-source monitoring platforms: Checkmate and Uptime Kuma. It looks at their core features, dashboards, resource efficiency, deployment flexibility, and real-world use cases.
Table Of Content
Open Source Server Monitoring: What is Uptime Kuma?
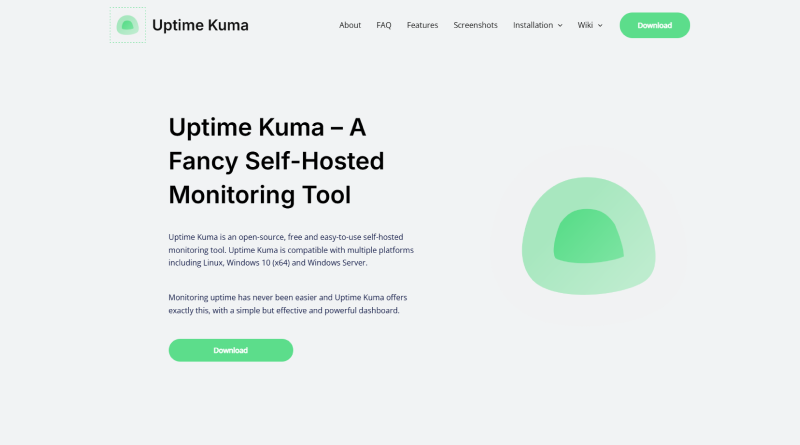
As businesses rely more on their digital infrastructures, uptime monitoring is becoming important to ensure reliable services. Uptime Kuma is currently one of the most popular open-source uptime monitoring solutions available for developers/IT teams who need a lightweight, yet feature-rich method to monitor their websites, servers, APIs, and Docker containers.
Uptime Kuma was built with ease of use and accessibility in mind; it provides a modern self-hosted monitoring solution that does not require the complexity associated with enterprise-grade observability platforms. With its streamlined interface, rapid deployment process, and support for a wide variety of protocols, users commonly choose to use Uptime Kuma over other self-hosted monitoring products.
– Overview and Origin
Uptime Kuma consists of a monitoring solution created by developer Louis Lam and released to the public in 2021. Uptime Kuma has developed an active user base as a monitoring platform due to its user-friendly interface and ease of implementation (installation and configuration). Unlike other common monitoring solutions, Uptime Kuma aims to provide a simple user experience while providing reliable uptime monitoring and alerting services.
Uptime Kuma can be deployed using Docker or Node.js hosting environments. In addition to that, it can also be deployed by robust cloud and VPS service providers. This makes it an attractive option for developers to have Docker container monitoring or use it for monitoring website uptime via Docker.
With the continued growth of the Uptime Kuma ecosystem, it has quickly gained the traction of one of the premier open-source server monitoring platforms available.
– Uptime Kuma Features
One of the best things about Uptime Kuma is its combination of simplicity and functionality. Uptime Kuma has many fundamental monitoring capabilities for the sole developer and the small to medium-sized professional developer.
Since it’s an open-source application, it allows users to monitor the status of their websites using both a web hosting interface and a REST API. It also supports different protocols, such as TCP and HTTP(S), making it easy for users with multiple types of infrastructure to deploy and configure the application.
Uptime Kuma has many unique features that make it an ideal application for individuals or businesses of all sizes.
Uptime Kuma: Key Features
- 1 Real-time uptime monitoring for websites, APIs, servers, and apps.
- 2 Support for multiple protocols (HTTP(S), TCP, ping, DNS, and more).
- 3 Ease of use and easy Docker deployment.
- 4 Beautiful and responsive Docker monitoring dashboard.
- 5 Customizable status pages to allow public visibility of services.
- 6 Instant alert notifications via Discord, Slack, Telegram, email, PagerDuty, and many other integrations.
- 7 SSL certificate monitoring and expiration alerts.
- 8 Lightweight architecture for lower resource consumption.
- 9 Multi-language support and mobile-friendly UI.
- 10 Active open-source community with constant feature updates.
Another plus with Uptime Kuma is its native support for Docker deployments. This function is appealing to teams that want to monitor their website uptime with Docker without the complex enterprise-level monitoring stacks.
– Who Uses Uptime Kuma?
Being a popular open-source monitoring tool, it’s used by users of all sizes due to its low entry cost and flexible deployments. Basic users of the platform include:
User Type
Industries / Teams
DevOps engineers use Uptime Kuma to manage cloud-based servers and monitor containerized workloads running across different environments.
System admins rely on Uptime Kuma to monitor websites, APIs, servers, and internal services with real-time uptime tracking.
Freelancers and digital agencies use Uptime Kuma to manage uptime monitoring for multiple client websites and hosted services.
Startups choose Uptime Kuma because it offers an affordable self-hosted monitoring solution without expensive enterprise licensing costs.
Developers commonly use Uptime Kuma for personal hosting environments, development testing, and home lab monitoring setups.
Small and mid-sized companies use Uptime Kuma as an open-source monitoring platform with no licensing fees and flexible deployment options.
Uptime Kuma is often the first step for organizations transitioning from SaaS monitoring platforms to a fully self-hosted monitoring strategy.
Uptime Kuma is a great first step for organizations moving from a SaaS solution and developing an entirely self-hosted monitoring strategy.
Modern Server Monitoring: What is Checkmate?
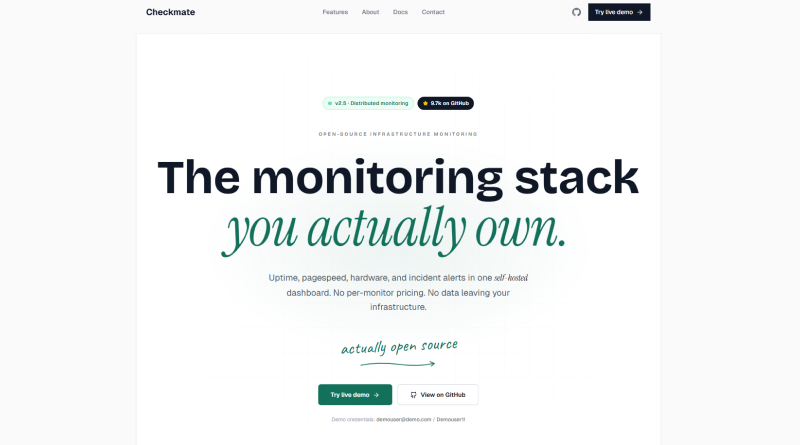
With the increasing containerization and distributed infrastructures, developers need not only basic uptime monitoring but also real-time analysis, alerting, and multiple levels of insights into their applications and servers. With modern cloud-server-native development, Checkmate is in the process of being established as an open-source platform to provide developers with deeper visibility into their applications. It offers real-time analytics and insights into how the applications perform on multiple levels of infrastructure.
Unlike most simplistic uptime monitoring tools, Checkmate is positioned as a comprehensive observability platform by combining uptime monitoring, performance monitoring, and system metrics into one single self-hosted monitoring solution. Therefore, it is applicable to teams looking to use Docker container monitoring along with other open-source server monitoring tools as part of a modern DevOps workflow.
– Overview and Origin
Checkmate was created to provide developers with an alternative to traditional uptime checks and Docker monitoring dashboards. It features a deeper level of performance visibility and insight into their cloud-native and containerized infrastructure.
Checkmate has gained popularity among developers because of its scalable full-stack architecture, which combines JavaScript frontend components with optimized backend services for real-time data processing. Why? Well, developers can use Checkmate instead of relying on generic SSH or API-based uptime checkers available via Docker containers.
Checkmate’s self-hosted project nature provides users with complete autonomy over their monitoring data, infrastructure configuration, and alerting pipelines. As a result, it is a well-suited alternative to SaaS-style solutions, particularly where data privacy and customizations are important.
– Checkmate Features
Checkmate offers a broader feature set compared to traditional uptime monitors, focusing on infrastructure observability and actionable insights.
Checkmate: Key Features
- 1 Real-time monitoring of web/app servers, websites, APIs, and containerized applications via Docker.
- 2 Monitoring of container-based application statuses with integrated monitoring tools.
- 3 Additional metrics about the performance and status of hosted applications.
- 4 Additionally, Checkmate incorporates multiple infrastructure monitoring components into a single location via dashboards.
- 5 Alerts can be set up based on various thresholds, with instant notifications sent when one or more threshold conditions are met.
- 6 Distributed infrastructure monitoring.
- 7 Intuitive dashboard/interface supported by analytics to facilitate timely decision-making.
- 8 Allows for monitoring data to be hosted on your own hardware (self-hosted) at your own location, providing 100% ownership over all data collected.
- 9 Easily scalable architecture designed specifically for scalable monitoring workloads.
- 10 Ability to provide a unified Docker application/service monitoring experience across multiple types of systems.
Due to its vast array of capabilities, Checkmate is not only an uptime tool but also a lightweight monitoring layer for DevOps teams to manage multiple services.
– Who Uses Checkmate?
Checkmate provides advanced visibility of your systems, which goes well beyond basic uptime monitoring. Users of the platform are:
User Type
Industries / Teams
DevOps engineers use Checkmate to report on and monitor cloud-native infrastructure across modern deployment environments.
Backend and platform engineers rely on Checkmate while working with containers, distributed systems, and scalable backend services.
Teams running multi-service architectures use Checkmate to centralize monitoring and manage service visibility from a single dashboard.
Organizations use Checkmate to monitor application performance, service availability, and uptime across production environments.
Developers building scalable applications with Docker containers and microservices use Checkmate for infrastructure monitoring and reliability tracking.
Technical teams often choose Checkmate as an alternative to traditional monitoring stacks for greater flexibility and modern deployment compatibility.
Many people use Checkmate because they seek to move from basic open-source tools available for uptime monitoring. It offers them an organized observability approach without interacting with heavy-duty enterprise-level monitoring systems.
Feature-by-Feature Comparison: Checkmate vs. Uptime Kuma
| Feature | Uptime Kuma | Checkmate |
|---|---|---|
| Primary Focus | Simple uptime monitoring | Full infrastructure + uptime monitoring |
| Monitoring Scope | Website, API, basic service checks | Servers, apps, Docker containers, performance metrics |
| Docker Monitoring | Basic container status checks | Advanced Docker container monitoring with deeper insights |
| Dashboard | Clean, minimal, easy to use | Data-rich, analytics-focused dashboard |
| Alerts | Basic UP/DOWN notifications | Advanced alerts based on metrics + system conditions |
| Performance Metrics | Limited (response time, uptime) | Detailed performance & system-level monitoring |
| Status Pages | Simple built-in status pages | More advanced reporting & infrastructure visibility |
| Setup Complexity | Very easy, beginner-friendly | Moderate, requires more configuration |
| Scalability | Best for small to medium setups | Built for larger, distributed systems |
| Best For | Personal projects, small teams | DevOps teams, production-scale infrastructure |
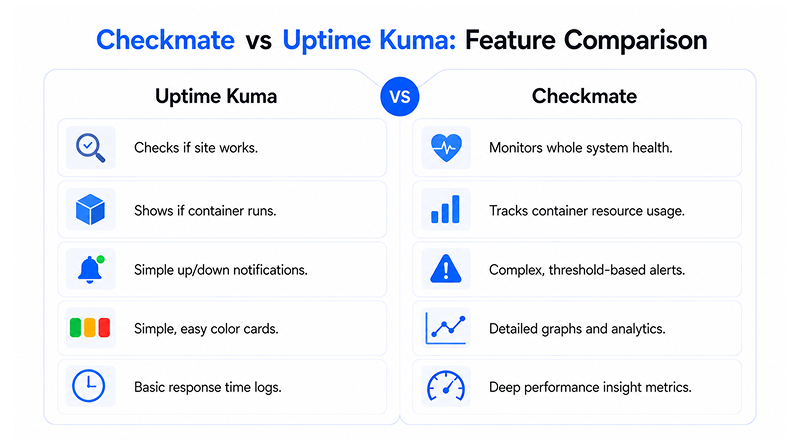
Both Uptime Kuma and Checkmate are powerful monitoring tools, but they target different levels of infrastructure complexity and monitoring needs.
The two tools are common in the current monitoring toolset used in DevOps, Docker, external APIs, and distributed services. However, they vary a lot when it comes to features of system monitoring, architecture and observability coverage.
1. Coverage & Scope of Monitoring Tools
Uptime Kuma is designed mainly for uptime monitoring of open source applications. The tool tells you if a specific service is reachable using any one of these methods: HTTP, TCP, PING, or DNS. It has limited capabilities to check the health of a service. Therefore, it is limited to monitoring basic website uptime checker setups using Docker.
On the other hand, Checkmate goes further by allowing full infrastructure monitoring, which includes metrics on the CPU, RAM, and disk on your servers, their performance, and providing information from your Docker containers, along with uptime data.
Summary
- If you want to monitor just uptime, use Kuma.
- If you want to monitor all aspects of your infrastructure, along with uptime, use Checkmate.
2. Monitoring Capabilities for Docker
Uptime Kuma does support monitoring of Docker containers, but it has limited use in monitoring whether a Docker container is running.
Checkmate, on the other hand, provides more depth of monitoring for Docker containers by providing greater insights into service health, system metrics, and performance with a great deal of visibility (through agents and integrations) than what Uptime Kuma offers.
Summary
- Use Kuma when you need lightweight Docker status tracking
- Use Checkmate when the requirement is for a full Docker monitoring dashboard.
3. Alert Notifications
The alerting features of both self-hosted uptime monitoring tools are multi-channel; however, they differ in scope. Uptime Kuma allows simple alert triggering with UP or DOWN metrics. In addition, it integrates with Discord, Telegram, email, and Slack.
On the flip side, Checkmate has advanced alert capabilities tied to infrastructure metrics, performance thresholds, and multi-sourced signals.
Summary
- If your needs are for simple alerts, then go with Uptime Kuma.
- When you need advanced observability alerts, choose Checkmate.
4. Dashboards
Both Uptime Kuma and Checkmate dashboards provide a user-friendly interface for your alerts; however, they require different levels of user skills to utilize the interface effectively.
In simple terms, Uptime Kuma provides a straightforward interface that is designed especially for easy user setups and alert monitoring.
However, the Checkmate dashboard provides a more complex interface with a data-dense design that provides analytics, metrics, and a visual representation of your infrastructure.
Summary
- Uptime Kuma wins for a simplistic approach to the configuration of alerts.
- Checkmate provides a better long-term solution for building investment in the infrastructure.
5. Performance Monitoring
Both tools provide the user with performance monitoring reports. However, the difference here is that the type of data provided varies according to the tools. Uptime Kuma provides response time/availability reports, while Checkmate provides performance metrics (i.e., PageSpeed insights, etc.) in addition to uptime tracking.
Summary
- Choose Checkmate as it provides a larger view of performance observability.
- Uptime Kuma is only for simple uptime monitoring reports.
6. Scalability
Uptime Kuma and Checkmate are both simple and easy to implement; however, there are differences in which environments they would be most practical to utilize. Uptime Kuma, being lightweight and simple, quickly becomes limited once deployed to larger monitor quantities and distributed systems.
On the other hand, Checkmate is capable of performing functions successfully throughout complex infrastructure, including large-scale distributed systems with agent-based deployment.
Summary
- Uptime Kuma appeals to users with small or medium-sized systems.
- Checkmate will appeal to users with larger or more complex infrastructures.
7. Status Pages and Reports
Uptime Kuma has a built-in simple status page to let you show the health of your services. Checkmate has a much more advanced way to monitor incidents than Uptime Kuma. It provides much more detailed reports through the use of infrastructure monitoring.
Summary
- Both Uptime Kuma and Checkmate provide status pages.
- However, Checkmate is much more geared for larger enterprise use.
8. Learning Curve and Complexity
Uptime Kuma is easy to use, allowing you to set up a Docker-based monitoring solution quickly. But with Checkmate, you need to set up and understand the technical content around your infrastructure.
Summary
- Uptime Kuma is easier to use than Checkmate.
- Checkmate has greater skills but comes with complexity.
9. Dashboard and User Experience
The monitoring tool you use will ultimately provide you with a way to understand quickly what is going on with your infrastructure.
Uptime Kuma is a clean, simple, and highly visual monitoring tool that optimally displays your service’s current status on its dashboard. There is no need to scroll through huge menus before you can find out whether your services are online!
Uptime Kuma UI/UX Features
- Service monitoring is done using an intuitive card layout for an easy overview of each service’s health.
- Each card uses a color-coded status indicator to identify whether it’s up, down, or degraded.
- There is a fast setup process with minimal configuration steps required.
- The Checkmate platform has a mobile-friendly layout to help monitor from anywhere.
- Status pages can be published and shared easily.
- Checkmate’s biggest advantage is the ability for non-technical users to quickly comprehend system health within seconds, thus making it a great platform for teams who want a lightweight monitoring dashboard without any complexities.
Checkmate UI/UX Features
- Multi-panel dashboard showing all servers, services, and containers.
- Heavy analytics-based interface with more in-depth views of metrics.
- Offers a delineated layout for large-scale infrastructure management.
- Better suited for multi-service environments and DevOps workflows.
- Emphasis on observability (rather than just uptime) with system usage and behaviors.
Summary
- Uptime Kuma’s interface is modern.
- Checkmk’s interface provides actionable insights, especially for managing Docker-based & distributed systems.
10. Performance & Resource Usage
Choosing the right self-hosted monitoring tools necessitates that performance and system overhead be priorities, especially in managed VPS or limited server resources. Uptime Kuma’s main selling point is its lightweight and high efficiency.
Uptime Kuma Performance
- Light CPU and RAM footprint.
- Runs easily on small VPS instances.
- Has little background processing overhead.
- Allows continuous uptime checks without overtaxing your system.
- Quick startup with a responsive user interface even on basic hardware.
Checkmate has more overhead than Uptime Kuma because of its enhanced monitoring capabilities.
Checkmate Performance
- Higher CPU and RAM use than Uptime Kuma.
- Collects more metrics that are relevant like, servers, containers, performance data.
- Designed to operate in scalable infrastructure (LAN/WAN) environments.
- Generally requires a more robust VPS or dedicated server to operate effectively.
- Trade-offs between resource requirements and detailed observability.
Summary
- Uptime Kuma is the preferred choice of users for personal projects, small businesses, or as a simple open-source server monitoring and observability tool.
- Checkmate is generally the better choice in a production environment because of detailed observability.
Checkmate vs. Uptime Kuma (Pros & Cons): Which Is Better?
Both Uptime Kuma and Checkmate are robust self-hosted monitoring tools. Although they cater to slightly different requirements. Below is a high-level overview of their respective pros and cons.
Pros and cons of Uptime Kuma:
👍Pros
Beginner-friendly and simple to install
Suitable for low-resource VPS
Clean and straightforward dashboard for monitoring status at a glance
Great support for common use cases of basic uptime monitoring in open source
Fast and simple Docker setup with minimal configuration
Provides built-in status pages for public-facing services
Large active community with constant updates
Excellent choice for a simple website uptime checker and Docker configurations
⚠️Cons
Limited observability of infrastructure on a deeper level
No analytics or metrics for system performance or advanced use cases
Not a good fit for more complicated distributed systems
Basic monitoring capabilities for Docker (mainly for checking if the container is available)
For larger enterprises or DevOps environments, Uptime Kuma is simple
Pros and cons of Checkmate:
👍Pros
In-depth monitoring capabilities for infrastructure, not just uptime
Strong focus on improving Docker containers and overall health monitoring of systems
More advanced metrics and performance data is available
Excellent for use in distributed systems and multi-service environments
Checkmate is designed for better scalability when using DevOps practices
A unique and all-in-one dashboard that consolidates servers, applications, and containers
Designed for a higher level of observability and analytics
⚠️Cons
Much higher resource usage (compared to lightweight solutions)
More complex to set up and configure
Difficult to learn for a beginner
It can be excessive for smaller websites or projects
It needs more planning with infrastructure for optimal results
Uptime Kuma vs. Checkmate: Which One Should You Choose?
Uptime Kuma and Checkmate are both solid self-hosted monitoring options, so the actual level of infrastructure monitoring should be considered instead of choosing ‘the best’ tool.
When to Choose Uptime Kuma
To deploy quickly in a Docker-based environment.
Basic uptime monitoring only.
Monitoring smaller (< 1 GB) websites, APIs, or personal projects.
You want a minimal and clean UI that is easy to navigate.
You require a lightweight uptime checker that can run within a Docker container.
If you do not need detailed performance metrics or infrastructure analytics.
You are a solo developer, freelancer, or small team.
In short, Uptime Kuma is a great fit when all you want to find out is: “Is my service currently available?”
When to Choose Checkmate
You have multiple servers, services, and distributed systems.
You want to monitor your Docker containers with deeper insights.
You want visibility into CPU, memory, disk, and performance metrics.
You’re building a scalable Docker monitoring dashboard for your production systems.
You would rather have data-driven observability than just an uptime check.
You work in a DevOps or infrastructure engineering team.
You are looking for something more advanced than basic monitoring tools.
In short, Checkmate does a better job for overall system behavior comparison rather than just providing an uptime status.
Final Wrap Up
These two tools are important to the management of modern infrastructure, as there is a growing trend towards self-hosting monitoring tools and open-source server monitoring tools.
The ultimate decision rests between simplicity vs. observability depth and which one you feel matches your current infrastructure maturity.
FAQs
1. What is the difference between Checkmate and Uptime Kuma?
Uptime Kuma is tailored to simple, lightweight uptime metrics, whereas Checkmate provides a more extensive set of services covering infrastructure, physical servers, virtualized containers, and performance data for development and production environments.
2. Are Checkmate and Uptime Kuma both Docker-enabled?
Yes, both tools work well within Docker. Uptime Kuma is known for quick and easy deployments and configuration due to its relatively low resource requirements. Since Checkmate has a much broader set of monitoring services and infrastructure components, it is also compatible with Docker but may require some additional configurations and is less efficient in resource utilization as compared to Uptime Kuma.
3. Can Checkmate be used by multiple users?
Checkmate was designed to accommodate a multi-user environment to enable teams with shared hosting infrastructure to work on the same system. Therefore, it’s capable of supporting collaborative monitoring across multiple servers, applications, and Docker containers for distributed development and for production development through role-based access controls.
4. What tool has superior alert/notification integrations?
Both tools have the capability of sending out alerts, just in different ways. Uptime Kuma supports a plethora of straightforward and effective integration options through notifications (Telegram, Discord, Slack, and email), making basic uptime alerts easy to receive. Checkmate’s alerting features, however, are more advanced, associated with performance metrics and system health, and capable of identifying incidents at the infrastructure level and monitoring them.
5. What is the best monitoring tool for novice users?
Uptime Kuma is well-suited for novice users, offering a straightforward interface and easy setup that makes website and service monitoring possible within minutes. Checkmate, on the other hand, is designed for users who require advanced monitoring capabilities, as its extensive feature set is best utilized with a strong understanding of DevOps practices and infrastructure monitoring tools.