
 Jackson Lane
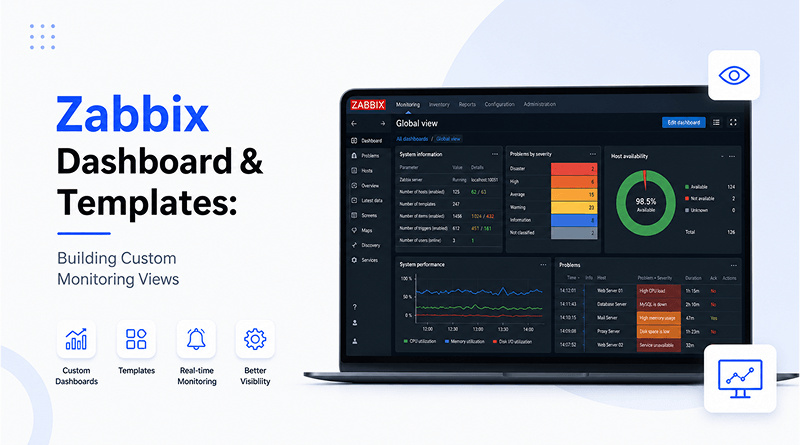
Ten widgets refresh on a screen every few seconds, and only one of them holds the number an engineer actually needs at that moment. That single detail, buried under charts nobody asked for, separates a monitoring setup that works from one that just looks busy. A dashboard built around clarity changes how fast a team notices, understands, and responds to what its infrastructure is reporting.
Zabbix earned its place among open-source monitoring tools because it lets a team decide exactly what that clarity looks like. Every server, container, and application running across a web hosting environment produces its own signals, and a well-designed dashboard turns those signals into something a person can act on within seconds rather than minutes.
In this post, we will explore how the Zabbix dashboard interface works, how custom widgets and templates come together, and how different teams can shape monitoring views around what they specifically need to see.
Table Of Content
What is the Zabbix dashboard?
The Zabbix dashboard sits at the top of the platform’s interface, above raw data collection and trigger logic. Every metric Zabbix gathers, from CPU load to HTTP response codes, needs a place to surface, and the dashboard is where that happens for the people watching it. A small setup might run with one shared view. A larger environment often runs several, each built for a specific audience.
How does the Zabbix dashboard interface work?
A Zabbix dashboard is made of a few core pieces, and each one plays a different role once real data starts flowing through it.
Dashboard building blocks
Widgets
The individual blocks on a dashboard, each showing one type of data such as a graph, a problem list, or a host availability map. A single dashboard can carry dozens of these, depending on how much a team wants visible at once.
Pages
Group related widgets together so a single dashboard can hold several views without turning into a wall of charts, keeping related metrics side by side instead of scattered across separate tools.
Sharing options
Control who can view or edit a dashboard, which becomes relevant the moment different departments need different levels of access to the same underlying data.
Getting started vs. scaling up
Default vs. Custom dashboards
Out of the box
Zabbix comes with default dashboards that give a reasonable starting point for a new install. Most teams outgrow them fast once infrastructure spans more than a handful of hosts.
Built for scale
Organizations running monitoring on a cloud platform often rebuild these defaults entirely, because scalable infrastructure generates metrics that generic layouts cannot display.
How do you create your first custom dashboard widget?
Setting one up takes a few minutes once the dashboard layout feels familiar, and the steps below work the same way whether Zabbix runs on a dedicated server or a VPS hosting plan.
Setting up a dashboard widget
1
Open the dashboard
Navigate to the Dashboards section from the main Zabbix menu and select the dashboard to edit, or create a new one.
2
Add a widget
Click Add widget and choose a type such as Graph, Problems, or Host availability.
3
Configure the data source
Select the host, item, or trigger the widget should pull data from.
4
Set the refresh interval and save
Choose a refresh rate that matches how often the data changes, then save the dashboard.
What are Zabbix templates?
A template packages the configuration a team would otherwise repeat manually.
What a Zabbix template includes
A Zabbix template bundles items, triggers, and graphs into one reusable package built around a specific device or service type. Applying it to a host instantly attaches its entire monitoring logic in a single step, rather than recreating each item and trigger individually. The same template can attach to hundreds of hosts at once, which keeps the underlying configuration identical across every one of them.
Why templates save configuration time
Manually configuring monitoring for dozens of servers invites inconsistency since one host is inevitably configured slightly differently from the rest. Zabbix templates remove that risk by keeping configuration identical across every host that shares one. Teams already coordinating several AI-powered tools in their stack tend to value this consistency even more, since it keeps monitoring aligned as the stack itself continues to change.
Which Zabbix dashboard templates work best for server monitoring?
Two categories cover most server environments, and both live in the same official repository.
Linux server templates
These track CPU load, memory usage, disk space, and running services to give a general view of system health.
Windows server templates
These follow the same setup but include platform-specific metrics such as event logs and IIS performance where relevant.
How to find and import official templates
The official Zabbix template repository stays updated alongside new platform releases and community contributions. Importing a template takes a few clicks through the configuration screen, and it populates the linked dashboard with matching widgets immediately. Templates that track certificate expiry also keep SSL security visible on the same dashboard, so an expiring certificate gets flagged well before it causes an outage.
How do you set up website monitoring on your dashboard?
A website behaves like any other monitored host once a web scenario is in place.
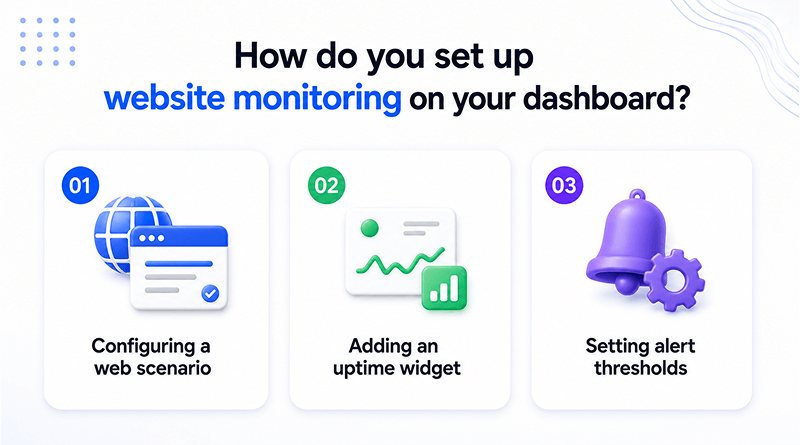
Configuring a web scenario
A web scenario checks uptime, response time, and specific page content at intervals a team defines, turning a URL into a monitored resource rather than a black box.
1
Adding an uptime widget
Once the scenario runs, the uptime widget shows those results right next to server metrics on the same dashboard. A team no longer needs a separate tool to verify whether the website is up.
2
Setting alert thresholds
Thresholds decide how much downtime or latency triggers a notification. A team sets that number high enough to skip small, temporary drops and low enough to still catch a real outage. A website running on an AI Website Builder still depends on the same server resources as any other property, so Zabbix website monitoring treats it no differently.
3
How can dashboards be customized for different teams?
The same data means something different depending on who’s looking at it.
NOC/operations view vs. executive summary view
An operations team needs a dense view packed with problem widgets and host status, refreshing constantly so that nothing slips through unnoticed. An executive summary works better as a simplified view showing uptime percentages and high-level trends, without the technical details that only an engineer would need to act on. Both views draw from the same underlying data, which keeps the numbers consistent even though the presentation looks entirely different.
Role-based dashboard sharing
Zabbix handles this split through role-based sharing, letting an administrator control who sees which dashboard and whether they can edit it. A marketing team managing client websites built on WordPress Portfolio themes benefits from this same separation, since its monitoring priorities rarely overlap with what a NOC engineer tracks.
How do you export and import dashboard templates across environments?
Moving a dashboard between environments doesn’t require rebuilding it manually.
JSON export and import walkthrough
Zabbix stores dashboard configurations in JSON format, which makes the entire layout portable as plain text. Exporting a dashboard from staging generates a file that captures every widget, page, and layout choice exactly as configured, and importing that file into production recreates the same structure in seconds, with no widget rebuilt manually.
Use case: replicating dashboards across environments
This process matters most when an application moves through a deployment pipeline and its monitoring view needs to follow it stage by stage. Some teams log these exports in a shared workspace such as Airtable to track which version is live and when it last changed.
What are the best practices for Zabbix dashboards?
A dashboard is only as useful as it is readable at a glance.
Widget count and performance
A dashboard integrated with thirty widgets rarely performs better than one built around ten well-chosen ones. Excess widgets slow page load and bury the metrics that actually need attention during an incident, especially when several of them poll the same data source at once. Trimming a dashboard down to what a team actually checks daily tends to improve both load time and readability.
Naming conventions
Clear naming for dashboards, pages, and widgets prevents the clutter that builds up as more people contribute over time. A business running a Hermes agent alongside its infrastructure benefits from the same practice, since an agent’s health metrics deserve a dedicated view rather than getting lost among unrelated widgets.
Key Takeaways
Dashboards and templates aren’t two separate features competing for attention; they’re two halves of the same job. Templates contain the monitoring logic, so every linked host knows what to verify and when to alert. Dashboards take that same data and shape it for whoever is actually looking at it, whether that’s a NOC engineer watching live metrics or an executive who just wants a quick health check. Used together this way, teams stop rebuilding monitoring from scratch every time something new gets added to the infrastructure.
The practical route is straightforward. Begin with the official Zabbix templates, adjust the layouts to suit different audiences, and keep naming conventions consistent as the environment expands. Do that consistently, and the setup grows right along with the infrastructure it’s watching, with new hosts picking up existing template logic automatically and new dashboards slotting in without disrupting what already works. That’s what makes the template and dashboard pairing worth the initial setup time; it keeps paying off long after the first dashboard goes live.
Frequently Asked Questions
1. Can I share a Zabbix dashboard?
Yes. Sharing works at both the user and user-group levels. An admin grants read-only or edit access without cloning the dashboard, so teams use one shared copy instead of maintaining several versions that eventually stop matching each other.
2. How do I monitor website uptime in Zabbix?
Set up a web scenario under the host representing the website. It checks response time, status codes, and page content at whatever interval you configure, and those results populate the uptime widget on the dashboard directly.
3. Can one Zabbix template apply to multiple hosts at once?
Yes, a template attaches to any number of hosts, and each one picks up the same items, triggers, and graphs when linked. Any later changes to the template automatically update all linked hosts, so you don’t have to update them individually.
4. How many widgets should a single Zabbix dashboard have?
No strict limit is set, but once a dashboard passes around 15 to 20 widgets, load times and readability both tend to suffer. At that point, distributing the content across multiple pages usually works better than keeping it on one screen.